 Skip to content
 La competitividad en la industria textil actual depende de la velocidad de respuesta, el control estricto de los costes y la optimización de los recursos disponibles. Las plantas que todavía gestionan su producción basándose en partes de trabajo en papel o en informes de Excel que se revisan a mes vencido operan con una desventaja crítica. La digitalización de la fábrica inteligente exige la monitorización visual, ágil y centralizada de la actividad productiva.
Para dirigir con éxito una planta moderna de tintorería, tejeduría y acabados, es indispensable definir e integrar Indicadores Clave de Rendimiento (KPIs) automatizados. La implementación de herramientas de inteligencia de negocio permite transformar las lecturas de la maquinaria en decisiones financieras y operativas estratégicas.
El Rol de los KPIs en la transformación digital textil
La digitalización y el uso de analítica avanzada responden a una necesidad urgente de competitividad a escala global. Estabilizar los costes operativos y optimizar el rendimiento de la maquinaria es el único camino para adaptarse a las tendencias globales de producción textil, las cuales señalan que la eficiencia basada en datos y la flexibilidad de la cadena de suministro son los factores que diferencian a las plantas líderes en el mercado internacional actual.
Un KPI textil es una métrica cuantitativa que evalúa la eficiencia, la calidad y el rendimiento económico de un proceso específico dentro de la cadena de fabricación de tejidos. A diferencia de los datos brutos de producción, un indicador clave ofrece contexto inmediato para identificar desviaciones respecto a los objetivos de la empresa.
Los indicadores en tiempo real permiten transicionar de una gestión reactiva, basada en resolver problemas una vez han ocurrido, a una gestión proactiva, donde las anomalías en el consumo de energía, las mermas de material o las paradas de maquinaria se corrigen en el mismo instante en que se producen.
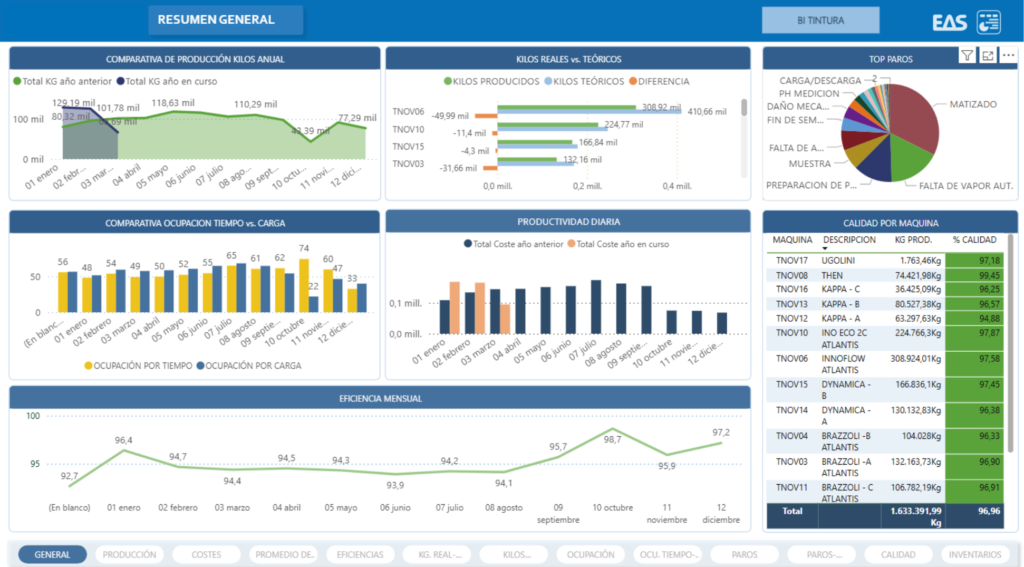
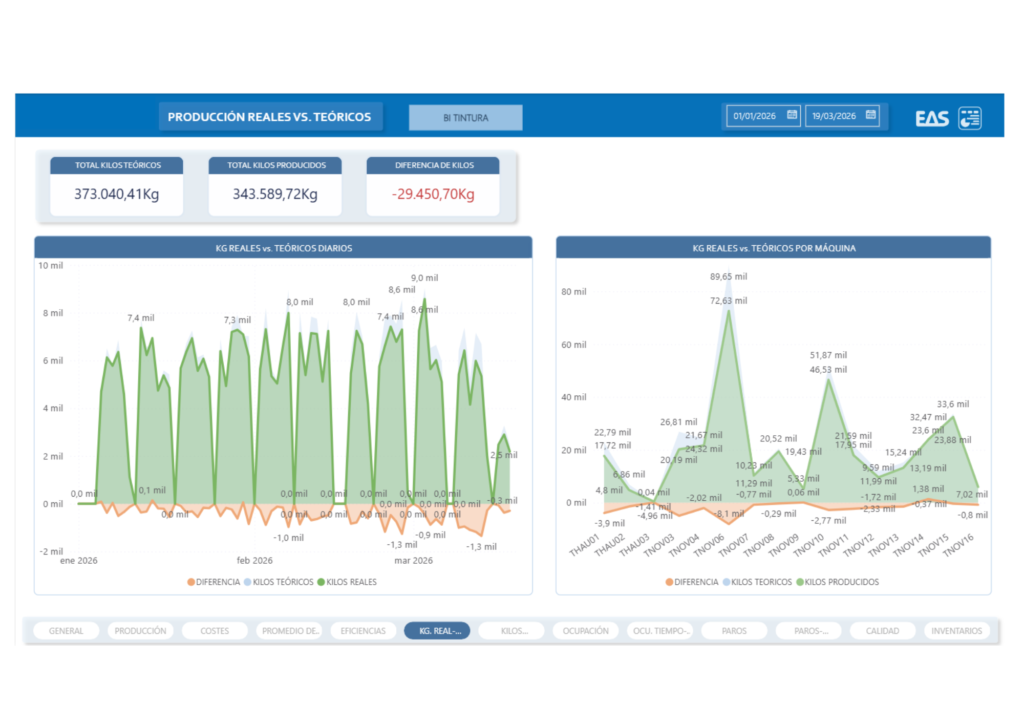
Para lograr esta visibilidad, la integración de las tecnologías de automatización es fundamental. Herramientas analíticas avanzadas como TexView, la solución basada en dashboards de Power BI desarrollada por EAS recopilan información de los sistemas MES y ERP de la planta para ofrecer una radiografía exacta del estado del negocio en cualquier dispositivo.
KPIs Críticos en la Planta de Tintorería y Acabados
La sección de tintorería y acabados es, por definición, una de las áreas más complejas debido al uso intensivo de agua, energía química y colorantes, además de la sensibilidad de los procesos térmicos. Los indicadores en esta sección deben centrarse en la precisión del proceso y la sostenibilidad financiera.
Índice de acierto al primer teñido (Right-First-Time – RFT)
El RFT mide el porcentaje de lotes de tejido que alcanzan el estándar de color y calidad aprobado por el cliente en el primer ciclo de producción, sin requerir correcciones, adiciones de colorante ni segundos teñidos.
- Fórmula de cálculo: RFT(%) = (Lotes aprobados en el primer ciclo / Total de lotes procesados) x 100
- Importancia: Un RFT bajo multiplica exponencialmente los costes operativos. Un segundo teñido duplica el consumo de agua, productos químicos y tiempo de ocupación de la máquina, destruyendo el margen comercial del pedido. La monitorización continua ayuda a aislar si los fallos provienen de una receta incorrecta o de una variación en las condiciones de la máquina.
Eficiencia en la Dosificación Automática de Colorantes y Químicos
Este indicador evalúa la precisión y el tiempo empleado por la cocina de colores automatizada para preparar y enviar las mezclas a las máquinas de teñido.
Mide la desviación entre los gramos de materia colorante solicitados por la receta del sistema de gestión y los reales dosificados por los equipos automáticos. Mantener una desviación mínima garantiza la consistencia del color entre diferentes lotes sin alterar las propiedades del tejido. La integración de los sistemas automáticos de EAS con plataformas analíticas permite detectar fallos de calibración en las válvulas antes de que afecten a la producción masiva.
Consumo Específico de Agua y Energía por Kilo de Tejido
Este KPI relaciona los recursos medioambientales y energéticos consumidos con el volumen real de producción textil terminada.
- Unidad de medida: Litros de agua por kilogramo de tejido (L/Kg) y Kilovatios-hora por kilogramo de tejido (kWh/kg)
- Utilidad: Permite auditar el impacto real de las recetas y los procesos de lavado o fijado térmico en las ramas tensoras. Un repunte en este indicador indica fugas en las instalaciones, ineficiencias en los intercambiadores de calor o una programación inadecuada de las cargas de las máquinas.
La optimización en el consumo de recursos hídricos y energéticos ya no es solo una estrategia de ahorro interno, sino una respuesta directa a las exigencias regulatorias del mercado internacional. Alinear los indicadores de eficiencia de la planta con las estrategias de la industria textil en Europa permite a las empresas anticiparse a las normativas de sostenibilidad, facilitando la superación de auditorías ambientales exigidas por las grandes marcas globales.
KPIs Fundamentales en Tejeduría y Estampación
En las salas de telares y en las líneas de estampación (ya sea rotativa o digital), la rentabilidad está directamente vinculada a la velocidad de ejecución y a la continuidad de la maquinaria.
Eficiencia Global de los Equipos (OEE) en Telares
El OEE es el estándar de oro industrial para evaluar la productividad de la maquinaria pesada. Desglosa el rendimiento en tres factores críticos: Disponibilidad, Rendimiento y Calidad.
- Disponibilidad: Porcentaje de tiempo que el telar está produciendo frente al tiempo total planificado. Deduce las paradas por roturas de hilos, cambios de artículo o mantenimiento.
- Rendimiento: Velocidad real de inserción de pasada del telar comparada con la velocidad de diseño nominal de la máquina.
- Calidad: Metros de tejido conformes que cumplen con las especificaciones técnicas sobre el total de metros fabricados.
OEE (%) = Disponibilidad X Rendimiento X Calidad
A través de cuadros de mando interactivos en Power BI, los responsables de planta pueden visualizar el OEE general de la nave de tejeduría y filtrar los datos de forma individualizada para descubrir qué telares específicos muestran cuellos de botella mecánicos o problemas reiterados con materias primas de baja resistencia.
Densidad de Defectos por Metro Lineal
Mide el número de fallos físicos detectados en el tejido (puntos caídos, pasadas dobles, manchas de aceite, roturas de urdimbre) durante la fase de inspección en las mesas de revisado.
La meta de este indicador es estabilizar el proceso por debajo del umbral de tolerancia pactado con el cliente, asegurando la optimización de la calidad sin incurrir en costes excesivos de descarte. La identificación temprana de un aumento en la densidad de defectos ayuda a detener a tiempo un telar desajustado, evitando la generación de kilómetros de tejido defectuoso.
KPIs de Gestión Económica y Control de Costes Industriales
La eficiencia técnica debe traducirse de forma directa en rentabilidad financiera. Por ello, los dashboards modernos conectan los datos capturados en el suelo de fábrica con las realidades contables de la empresa.
Desviación del coste estándar frente al coste real
Este indicador financiero calcula la diferencia entre el coste estimado de producción de un artículo (basado en la ficha técnica teórica de hilos, colorantes, tiempos y energía) y el coste real final registrado tras su paso por la planta.
| Componente del Coste | Causa de la Desviación Posible | Acción Correctiva con TexView |
| Materia Prima / Hilos | Mermas excesivas en el arranque del telar. | Ajustar longitudes de urdimbre y programación. |
| Colorantes y Productos | Ajustes de tono manuales por error de proceso. | Revisar mantenimiento de la cocina de color. |
| Energía / Vapor | Tiempos de espera con la máquina caliente. | Optimizar la secuenciación de carga en el MES. |
| Mano de Obra | Paradas prolongadas por cambio de artículo. | Implementar metodologías SMED guiadas por datos. |
El uso de un software de analítica como TexView permite cruzar los datos del ERP TexDrive con los consumos medidos por el sistema MES InfoTint. El resultado es la identificación visual inmediata de qué pedidos o clientes específicos están reduciendo el margen de beneficio real de la compañía debido a ineficiencias ocultas.
Integración de Sistemas: El Flujo de Datos entre MES, ERP y Power BI
La captura de los indicadores clave no puede depender de la introducción manual de datos por parte de los operarios, ya que este método introduce retrasos y errores humanos inevitables. La planta textil moderna fundamenta su analítica en una infraestructura de datos conectada en tres capas bien definidas:
- Capa de Captura y Control (MES): El sistema de ejecución de fabricación, como InfoTint, se conecta físicamente a los autómatas de las máquinas de tintorería y acabados. Registra temperaturas exactas, tiempos de ciclo, curvas de enfriamiento y dosificaciones en tiempo real.
- Capa de Gestión Comercial (ERP): El sistema TexDrive administra las órdenes de fabricación, los costes teóricos de los inventarios de hilo, el stock de colorantes y los plazos de entrega comprometidos con los clientes.
- Capa de Inteligencia de Negocio (Power BI con TexView): Actúa como el cerebro unificador. Extrae la información de las dos capas anteriores, la limpia, la procesa y la transforma en gráficos interactivos e intuitivos accesibles para gerentes, directores de producción y responsables de calidad.
Esta integración bidireccional garantiza que cuando un indicador muestra una anomalía, el usuario puede realizar un análisis detallado (drill-down) desde el rendimiento general de la empresa hasta llegar a la orden de fabricación o al lote de tinte concreto que causó la desviación.
Ventajas y Recomendaciones de la Monitorización Avanzada
La implementación de un sistema estructurado de KPIs mediante herramientas analíticas de última generación ofrece beneficios tangibles de manera inmediata, aunque también requiere un enfoque metodológico adecuado para superar los desafíos técnicos iniciales.
Ventajas Principales
- Visibilidad unificada: Centraliza la información de múltiples departamentos (tejeduría, tintorería, acabados) en un único punto de acceso.
- Reducción de tiempos de parada: Permite reaccionar instantáneamente ante caídas en el rendimiento de los telares o desviaciones térmicas en las ramas.
- Optimización de márgenes: Facilita el cálculo exacto del coste por kilo fabricado, permitiendo ajustar las tarifas comerciales a la realidad operativa de la planta.
- Sostenibilidad demostrable: Proporciona datos históricos fiables sobre el consumo de agua y energía, esenciales para auditorías y certificaciones internacionales.
Recomendaciones de Implementación
Para asegurar el éxito en la adopción de estas tecnologías, se aconseja priorizar la claridad sobre el volumen de datos. Es preferible dominar y actuar sobre cinco KPIs críticos que saturar los paneles con cincuenta métricas secundarias que diluyan la atención del equipo de gestión.
Asimismo, es indispensable involucrar al personal de planta desde el primer momento. Los operarios y encargados deben comprender que los dashboards visuales de TexView no son herramientas de control punitivo, sino asistentes tecnológicos diseñados para facilitar su trabajo diario, eliminar tareas administrativas repetitivas y asegurar la estabilidad de los procesos industriales.
Preguntas Frecuentes sobre KPIs Textiles
¿Qué diferencia existe entre los datos de un sistema MES y los dashboards de Power BI?
El sistema MES se enfoca en la operación, el control directo y el registro de los eventos mecánicos y químicos de las máquinas minuto a minuto. Power BI toma ese volumen masivo de datos históricos, lo combina con la información financiera del ERP y lo presenta en paneles visuales agregados orientados a la dirección estratégica y la optimización de costes.
¿Cómo ayuda la analítica de datos a reducir los costes de energía en acabados?
A través de herramientas como TexView, es posible correlacionar el consumo de gas o electricidad de las ramas de acabado con los tipos de tejido y los tiempos muertos entre lotes. Esto permite identificar si las máquinas se mantienen encendidas a altas temperaturas sin producir, ayudando a reprogramar las cargas de trabajo de forma eficiente.
¿Es complejo integrar TexView si ya contamos con maquinaria de diferentes marcas y edades?
No, la ventaja de las soluciones de EAS es su capacidad para interactuar con parques de maquinaria heterogéneos. Las interfaces y soluciones de automatización unifican las señales de los diferentes autómatas, permitiendo que Power BI reciba datos estandarizados sin importar el fabricante o la antigüedad del telar o la máquina de teñido.
Maximice la eficiencia de su planta textil con datos reales
El control intuitivo en la fabricación textil ha alcanzado sus límites históricos. Las empresas que lideran el mercado actual basan cada decisión operativa en datos consolidados, precisos y visualizados en tiempo real.
Implementar la combinación adecuada de KPIs en tintorería, tejeduría y acabados es el paso definitivo hacia la fábrica inteligente. Los dashboards avanzados de TexView, respaldados por la experiencia en automatización industrial de EAS, transforman la complejidad de su suelo de fábrica en cuadros de mando sencillos, accionables y orientados a la rentabilidad.
Consiga una visión completa y transparente de sus costes y rendimientos de producción.
- Solicite una demostración personalizada de TexView para ver cómo Power BI trabaja con los datos reales de su planta.
- Contacte con un especialista en digitalización textil para diseñar una estrategia de KPIs a la medida de sus necesidades.
- Pida información detallada sobre nuestras soluciones integrales de automatización y software MES/ERP.